Wednesday, September 19, 2012
US Historical Hurricanes
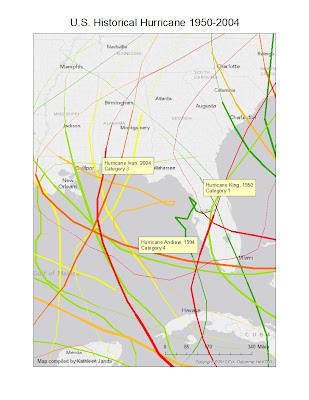
Here is a map I made of Historical U.S. hurricanes from 1950-2004. The different colored lines represent different decades and the thickness in the colored line represents what category the hurricane was. I have labeled a few of the hurricanes in the map to show this. I am using the Engineering paradigm approach with this data which basically uses science and technology. In order to take a complexity based approach to this hazard I would need data on environmental change such as deforestation and climate change and the concentration of people in rural and urban areas.
Subscribe to:
Post Comments (Atom)

No comments:
Post a Comment